
Collective on Geoeconomics
23rd August 2023
I] Introduction
With a multi-prong and multidimensional approach to retain as the sole hegemonic power – within an imperial hubris – the U.S. is attempting through tariffs, financial and technology sanctions, political provocations to – and military maneuvers near – Taiwan and an encirclement of China, the threaten banning of companies such as Huawei and Tik Tok: now it is an appropriate time to dissect the imperfections of a capitalist economy when competing with a state-run socialist model like China. As the U.S. cannot dismember a civilisation state, it tries to damage China’s economy by goading her to voluntarily commit economic suicide through implementing policies that will damage the country. Wide-spread and deeply-funded resources are allocated to spreading factually false propaganda regarding China’s economy. Such misleading yet generalised falsehood may present:
“The economic model that took the country from poverty to great-power status seems broken, and everywhere are signs of distress“, Aug. 20, 2023 wsj
Analysts would say “the absence of any major announcements of policy specifics does suggest a lack of urgency or that policymakers are struggling to come up with suitable measures to shore up growth“, asia times 26th. July 2023.
“China’s growth prospects weaken as economists cut 2023 forecast“, bloomberg 29th August 2022.
Read also Xi’s Age of Stagnation : The Great Walling-Off of China, Foreign Affairs, Sept/Oct 2023.
There is also the parallel goal of intentionally attempting to persuade others, especially the Third World emerging economies, not to learn from China’s economic success — because an understanding of the practical reality that China’s socialist economy is more efficient and successful than capitalism would be a devastating ideological blow to the U.S.’s rule-base assumptive international order. One of the prime ingredient of these falsehood claims is that China’s socialist economy is “inefficient” compared to capitalism — or, more specifically, that investment in socialist China is inefficient in creating economic growth compared to capitalist America or in general compared to capitalist countries. Needless to say that central to socialism’s goal is not mere abstract economic efficiency, but rakyat2 well-being and shared common prosperity.
Thus, arguing that capital enhancement is economic efficiency of capitalism – but ignoring super-exploitation in the continuance capital accumulation nor indicating the extracted value from labour (see Storm, May 2023, Labour exploitation and Capital accumulation factors; Storm, August 2023, Dependency and super-exploitation) – has U.S. perpetuated a claim of the “inefficiency of socialism”. That an alternative but efficiency economy integral to the socialist character of China’s economy is often debased.
Similarly, that an alternative politico-economic praxis can serve to re-orient the Madani Malaysia model narrative nuances, is ignored, too, (Storm,May 2023 and June 2023), especially when state of a nation under the clutch of IMF neoliberal policies is neoimperialism, (Storm, May 2023, Economic growth, retarded development).
Summarising:
Firstly, it is used to influence others that not only China investment is allegely “inefficient” , it should also lower its level of investment in GDP. This ulterior motive had successfully used earlier by the U.S. to derail its competitor economies of Germany, Japan and the Asian Tigers.
Secondly, more ideologically, the often articulated statements that China’s investment is inefficient, and capitalism’s is efficient, is an attempt to undermine and discredit socialism in promoting capitalism.
Thirdly, such propaganda is no more than an attempt to spread two interrelated falsifications:
• that China’s investment is inefficient in promoting economic growth;
• that this “inefficiency”, which doesn’t actually exist, is due to socialism as opposed capitalism.
We shall attempt – in applying John Ross main arguments, supported by data points from the World Bank’s World Development Indicators, U.S. Bureau Economic Analysis, and China National Bureau of Statistics – to show that Socialist China’s investment is much more efficient in creating growth than in capitalist countries such as the U.S. That this efficiency of China is integrally linked to the socialist character of its economy, and that such politico-economic praxis can serve to re-orient the Madani Malaysia model narrative nuances, (Storm, June 2023).
II] The international efficiency of China’s capital investment
A typical case can be taken from Business Week, where it was claimed: it takes $5 to $7 of investment to generate a dollar’s worth of gross domestic product in China, versus $1 to $2 in developed regions such as North America, Japan and Western Europe.¹
Similarly, Western economic analyst Charles Dumas claims: China is incredibly good at wasting savings through misallocating investment.²
The factual situation regarding efficiency of fixed investment in generating economic growth is shown in Table 1 — which portrays the world’s 20 largest economies ICORs (Incremental Capital Output Ratio – the additional unit of capital investment needed to produce an additional unit of output, generating subsequent increase in the gross domestic product). These together account for 80.4% of world GDP. If the Eurozone as a whole is included, and also South Africa, so as to include all BRICS countries, then the Table shows the ICORs for countries and economic regions accounting for 83.9% of world GDP, that is, for all economies which have a major impact on world growth. Taking a five-year average – thereby, avoiding short-term shifts in the business cycle – China had to invest 7.1% of GDP to generate 1% of annual GDP growth. This is characterised by China’s investment extremely low ICOR comparing with other countries which indicated its extremely high efficiency in generating economic growth. China was the second best out of the world’s 20 largest economies. In particular, China’s ICOR of 7.1 was more efficient than the US’s 10.0, the Eurozone’s 22.4, Germany’s 30.3, the U.K.’s 70.1 — not to speak of Japan’s ICOR which was a negative number, showing that its economy contracted despite its investment.

The implications of this fact is that China’s investment is extremely efficient by international standard.
III] Trends in a Socialist model’s ICOR
Turning from current international comparisons to historical developments, the Chart 1 shall show China’s ICOR since 1966 (post Great Leap Forward period) – presenting a five-year average for both gross domestic product (GDP) growth and the percentage of fixed investment in GDP to remove abnormalities in business cycle fluctuations, the indicative trends are distinctive:
From 1966-76 China’s ICOR rose sharply from 2.0 to 6.5. This was a serious negative development, a more than tripling of ICOR in a 10-year period, (or China have had to invest more than three times as high a percentage of GDP to maintain the same economic growth rate). The political events of this period in the Cultural Revolution is therefore obviously damaging to the then economy. After 1976 China’s ICOR began to improve — it had reached 5.1 by 1978. Following the systematic introduction of Reform and Opening Up in that year a prolonged improvement began and China’s ICOR fell to 2.5 by 1988. This showed the great improvement made by Reform and Opening up to China’s economic efficiency. This huge rise in the efficiency of investment following Reform and Opening Up launched the beginning of China’s “economic miracle” post-1978.
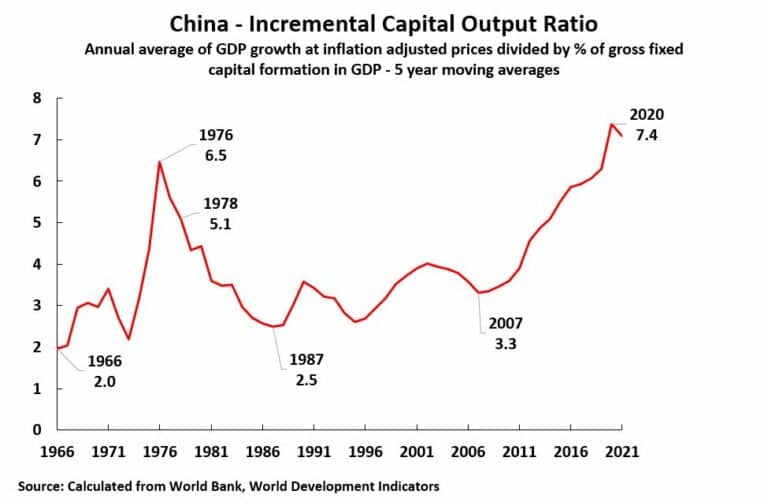
From 2007 China’s ICOR rose sharply to reach 7.4 in 2020. It is this trend that those who claim China’s investment is inefficient by international standards sometimes point to. However, most unfortunately, such commentators make two fundamental factual errors.
First, they fail to make international comparisons — it will be seen that the ICOR of other countries was also rising rapidly after 2007, in most cases by far more than China. That is, China’s worsening ICOR after 2007 was not some specific deterioration in China but as part of a process occurring internationally — a situational event created by the international financial crisis (or better known as the Great Financial Crisis {GFC’07}) which started after 2007 and during which China actually performed better than almost every other major economy. Second, many critiques have failed to point to the historical dynamic that as an economy becomes more developed its ICOR rises — and China is now approaching a “high income country” level by World Bank standards.
IV] Rising ICOR with Economic Development
Analysing first the rising ICOR which occurs with economic development, then in the founding work of modern economics, The Wealth of Nations, Adam Smith had already analysed that with increasing economic development fixed investment would play a greater role in economic growth — and that the percentage of fixed investment in the economy would rise. This was repeated by Ricardo. It was made a foundation of Marx’s economics in his analysis of the rising organic composition of capital. It was reiterated by Keynes. (Milton Friedman attempted to claim this claim was not accurate, but he made an elementary factual error in analysing only the U.S. economy and not international trends).
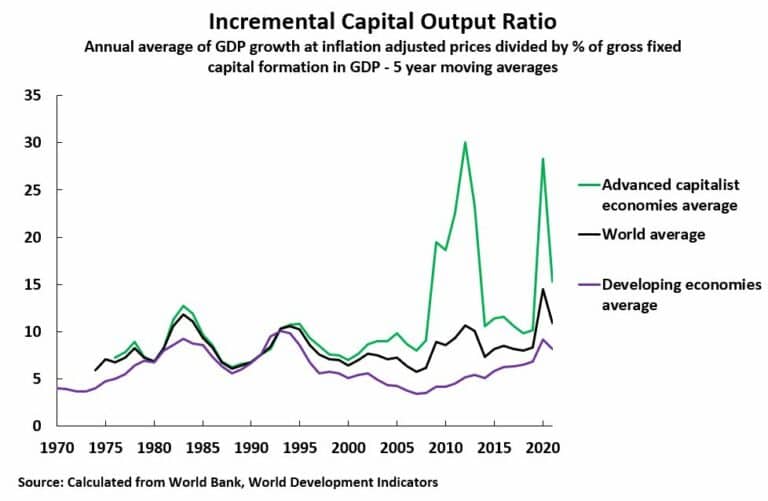
One of the manifestations of this increasing capital intensity of production with economic development is that ICOR rises as an economy becomes more developed. Thus, Chart 2 shows the historical reality that the ICOR of developed/high income economies is higher than the ICOR of developing economies. Taking the latest data, for the five years up to 2021, the average ICOR of developing countries was 8.2 but the average ICOR of high-income economies was 15.3. This, of course, has clear consequences for China as it undergoes economic development. It means that as China makes the transition to a high-income economy its ICOR should be expected to rise — such a rise would not reflect inefficiency but simply the effects of economic development.
Whether China’s fixed investment was inefficient could, therefore, not be established by showing that its ICOR had risen with time — whereby such a process would naturally occur with any economic development.
To requote Ross:
Inefficiency could only be established by a comparison to current economies at a similar stage of economic development — the comparisons, to be valid, would have to be with current economies, and not with historical cases of economies, due to the overall international rise of ICOR which has taken place particularly since 2007 and which is analysed below. This rise in ICOR is the first trend which affects China with economic development and shows why analyses which do not make international comparisons are invalid.
V] Comparison of China to other developing economies
Given this trend that ICOR will rise with economic development, then the relevant question to ask is whether China has maintained its advantage in efficiency of investment compared to other countries?
Chart 3 shows that the answer to this is clearly yes. Not only is the ICOR of developing countries lower than that for high income economies but China’s ICOR is lower than that for the average of developing countries. For all periods, except for the five years leading to 1976, China’s ICOR was lower than the average for developing countries. Taking the latest data, for 2021, the average ICOR of developing countries is 8.2 and for China 7.1.
China is – by World Bank standards – one of the most highly developed of developing countries, and has indeed within only a few years become a high income economy .

VI] The impact since the international financial crisis
While the increasing level of economic development of China would by itself have led to an increase in China’s ICOR, a second international process has been taking place since the international financial crisis (GFC’07) which has been negative for all countries — in particular high-income economies. Chart 3 shows this clearly. As can be seen, the ICOR for both high income and developing economies, and therefore the international average, has worsened since 2007:
• ICOR for developing economies rose from 3.5 in 2007 to 8.2 in 2021;
• ICOR for high income economies rose from 8.0 in 2007 to 15.3 in 2021;
• The world average ICOR rose from 5.8 in 2007 to 10.9 in 2021;
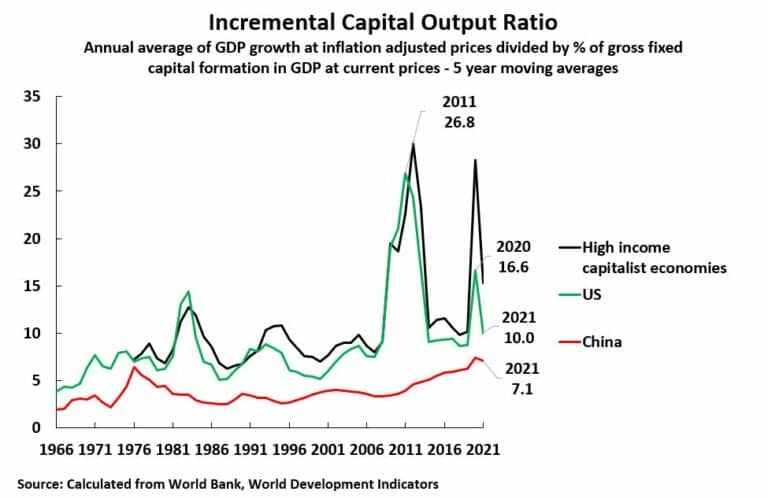
• China’s ICOR rose from 3.3 in 2007 to 7.1 in 2021.
Therefore, the worsening of China’s ICOR from 2007 to 2021 was not some process specific to China, to say representing part of a specific inefficient process within China, but was part of an overall international process in which ICOR rose globally. However, within this overall deterioration, China’s efficiency of investment in generating growth remained better than the average even for developing countries whose efficiency of investment in generating growth itself remained better than that for high income economies.
Regarding the major economies, as stated at the beginning, China’s efficiency of investment in generating growth was ranked second out the world’s 20 largest economies, thus, indicating a strong efficiency element in China’s investment.
A) Comparison with the U.S.
Often comparisons are most specifically made between China and the U.S., the ICORs for the two countries are shown in Chart 4.
As indicative, China outperforms the U.S. in the efficiency of investment in generating growth in all periods.

Chart 3 and Chart 4 clearly demonstrare that China has to invest less dollars to generate a unit of growth than the U.S. — as well as Europe or Japan.
B) An explanation of China’s ICOR worsening
Putting these trends together it can be observed why China’s ICOR would have increased since 2007 and why it is entirely misleading not to make international comparisons. Two macro-economic processes were occurring:
• China is making the transition from a developing to a high-income economy, that is to more capital-intensive production, therefore its ICOR will go up.
• There has been a general global worsening of ICOR under the impact of the international financial crisis and China is part of that trend; China just could not completely escape the consequences of the overall international economic situation.
Therefore, a rise in China’s ICOR after 2007 is entirely to be expected. The relevant measure is therefore the international one — that is, how has China’s efficiency of investment in producing economic growth changed relative to other current economies at a similar stage of development.
The factual factor is clear.
China’s efficiency of investment in terms of international comparisons is extremely high — in particular, superior to the U.S. Europe and Japan, as well as compared to other developing countries. What is factually obvious is not that China’s investment is inefficient in generating economic growth: that is a propaganda falsification which serious economists should not be taken in by, but how highly efficient China’s economy is in terms of international comparisons.
Therefore, after elaborating upon the above situational circumstances, and after having established the factual events, the reasonable question to enquire lays on why is China’s investment so efficient?
VII] In Socialism where investment is efficient
It is clear that the main reason for China’s very high efficiency of investment is due to the socialist character of its economy (Boer 2021) with an anti-crisis macro-economic strength. This fundamental process in ICOR can be discerned from Chart 5 below that shows the worsening of U.S. ICOR indicating the efficiency of its investment was not a smooth process at all. There are two specific periods of huge deterioration which were so severe that they affected average efficiency of US investment over the entire period. These were a more than doubling of ICOR to 26.8 in the period leading to 2011, that is following the international financial crisis, and a rise to 16.8 in the period leading to 2020 in association with the Covid induced recession.
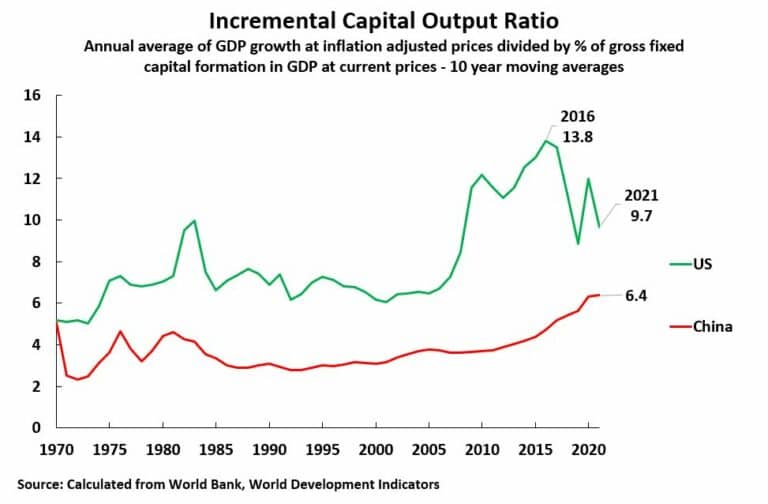
In short, economic crises led to a sharp worsening of U.S. ICOR, to a severe fall in her domestic investment. To illustrate clearly the long-term cumulative effects of such crises, and to smooth out the extreme short-term spikes, Chart 6 shows a longer term, 10-year, average for U.S. and China’s ICOR. The long-term cumulative worsening of U.S. ICOR under the impact of its successive economic crises is clear. In short, the fall in the efficiency of U.S. capital investment was particularly associated with capital crises in the U.S. economy.
A) America economic slowdown and rising ICOR
This process of economic slowing is shown in Chart 7. The U.S. went through two sharp recessions with negative growth — economic contraction of 2.6% in 2009 and of 2.8% in 2020. The contraction of the U.S. economy in crisis years sharply slowed its average growth rate and therefore raised its ICOR. In contrast, while China’s economy slowed since the beginning of the international financial crisis, that is, she could not entirely escape the negative consequences of the post-2007 financial crisis and the Covid pandemic. Consequently, the U.S.’s much weaker anti-crisis macro-economic capacity than China explains the superiority of China in efficiency of investment compared to the U.S. and is the primary explanation for the deterioration of U.S. ICOR — that is, for the worsening of the efficiency of U.S. investment.

B) The fall in US investment
On one central aspect, consumption is at a much higher percentage of GDP than fixed investment in the U.S. As an instant, in 2007, on the eve of the international financial crisis, consumption was 82.5% of U.S. GDP compared to 22.3% for fixed investment. It is this factual reality that fluctuations in the U.S. investment economy are so much more violent than the fluctuations in consumption which create its recessions. This may easily be seen by looking at the following fact:
Between 2007 and 2009, the latter being the worse year of the U.S. recession created by the international financial crisis, then overall U.S. GDP declined by 2.5% adjusting for inflation. The inflation adjusted fall in U.S. household consumption, which accounts for 82% of total U.S. consumption, was 1.5%. However, the inflation-adjusted fall in U.S. private fixed investment, which accounts for 82% of U.S. fixed investment, was at 27.6% — almost twenty times as severe as the fall in consumption.
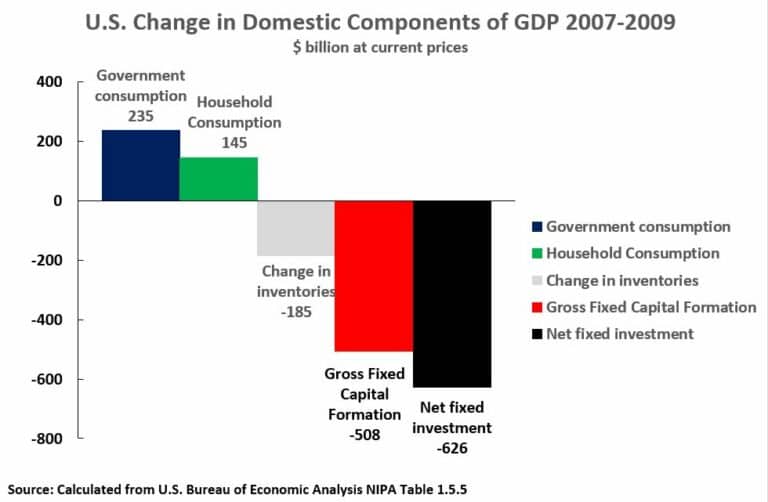
Chart 8 shows that, in current prices, between 2007 and 2009 U.S. household consumption rose by $145 billion and U.S. government consumption by $235 billion — a total rise in consumption of $380 billion. However, it must be emphasised that this increase in consumption was more than offset by $508 billion fall in gross fixed capital formation. That is, the post-international financial crisis recession was overwhelmingly created by the fall in investment, not in consumption. Moreover, depreciation of fixed capital during this period was $119 billion. Consequently, the fall in U.S. net fixed investment was even worse than that of gross fixed investment — a decline of $626 billion. Therefore by 2009, the U.S. capital stock was lower than in 2007, lowering U.S. potential for long term growth.
In summary, the U.S. recession after 2007, and therefore the worsening in U.S. ICOR, was due to the fall in U.S. fixed investment during the international financial crisis after 2007. The reason the U.S. was unable to control this fall in investment is equally clear. The U.S. is a capitalist economy. That means, by definition, its dynamic is determined by decisions of private capitalists. If these capitalists decide not to invest the economy goes into a tailspin into a recession (producing an increase in ICOR).
In short, there is no equivalent U.S. state sector sufficient to offset this. Private ownership of all the main means of production in the American national economy only ensues and ensures weakness in the U.S. macro-economic crisis mechanisms.
B) China’s socialist anti-crisis macro-economic mechanisms
In contrast to the U.S., the Chart 9 shows what occurred in China in 2007-09, even when faced with the international financial crisis.

In 2007 to 2009 China’s GDP, in inflation adjusted terms, rose by 20.0%. At the same time, China’s gross fixed capital investment rose more rapidly than any other major component of GDP — increasing by $890 billion, compared to $511 billion for household consumption and $233 billion for government consumption. China’s fixed capital depreciation in this period was $356 billion.
Therefore, China’s net fixed investment rose by $534 billion. China’s capital stock was significantly greater in 2009 than in 2007, increasing its potential for long term growth – in direct contrast to the U.S. trend., and a contradiction to US capitalism mode. That China’s fixed investment did not fall is because of being a socialist economy with a large state sector and state-owned banks which entirely dominate its financial system.
Following 2007, state investment, and financing of private investment by state-owned banks, could be used to prevent a fall in fixed investment. In contrast, the private capitalist U.S. economy had no such anti-crisis mechanism.
In summary, China’s large state-owned sector gave it much stronger macro-economic anti-crisis mechanisms than the U.S. capitalism mode. The obvious fact that China suffered no decline in output in any year during the international financial crisis, in turn, limited its rise in ICOR. So, it was the strength of China’s state sector, by preventing a fall in investment, which prevented recession and ensured China’s superior ICOR to the U.S. The macro-economic strength given to China by its state sector thereby ensured the high overall efficiency of China’s investment in generating growth.
C) Economic trends during the Covid pandemic crisis
First, Chart 10 shows that China’s economy far outperformed the U.S. during the pandemic period. In the three years 2019-2022 China’s GDP grew by 13.3% compared to the U.S.’s 5.2%. That is, during the pandemic China’s economy grew by more than two and a half times as fast at the U.S. capital investment.

[ Regarding the internal structure of the U.S. ECONOMY during this period the changes in current prices in the main domestic components of GDP are shown in Chart 11. As in 2007-2009 there was a substantial increase in household consumption, of $2,970 billion.
Government consumption also rose by $581 billion. Gross fixed capital formation also rose, by $838 billion, but this was insufficient to offset fixed capital depreciation of $848 billion. Therefore, U.S. net fixed capital formation fell by $10 billion — given the margin of error, and the small measured contraction, it is probably best to state that the rise in U.S. net fixed capital formation during this period was approximately zero. Clearly there was no significant addition to U.S. capital stock during 2019-2020 – may have even a marginal fall.]

Turning to CHINA (during the 2019-2021 period), Chart 12 shows that once again increase in gross domestic fixed capital formation was the single biggest contributor to China’s GDP growth in this period at $1,311 billion — as compared to $1,200 billion for household consumption and $428 billion for government consumption. This contrasts sharply with the U.S. pattern where, in 2019-2021, household consumption rose by $1,510 billion and gross fixed capital formation by $458 billion. Internationally comparable data for depreciation is not available for China after 2020 but given the fact that in 2020 fixed capital depreciation was $333 billion, and there is no reason to suppose it remotely reached almost $1,000 billion in 2021, it is clear that China’s net fixed capital investment was positive in the period 2019-2021.
[Turning to 2022, internationally comparable national accounts data for China have yet to be published, but from the data which has been released by the National Bureau of Statistics that the same pattern continued. This shows that in 2022 total consumption accounted for 1.0% of the increase in GDP, gross investment for 1.5%, and net exports for 0.5%. As inventories are only a small part of that figure for total investment, this clearly shows that the contribution of fixed investment to GDP growth remained the leading contributor to China’s GDP growth in 2022 and therefore also for the period 2019-2022 as a whole. This is the exact opposite of the U.S. pattern in which household consumption was the leading contributor and fixed investment low.]
D] The stabilizing role of China’s state investment
The reason for the high contribution of fixed investment to China’s GDP growth during the pandemic period is distinctively distinguished by Chart 13 that shows the way in which China’s state investment, during a crisis, could be used to offset the decline in private investment.

Even the Wall Street Journal presentation regarding China’s system of a socialist market economy, without understanding the significance of what it was saying in terms of the superiority of China’s socialist system, the newspaper has failed to mention that economies can pull two levers to bolster growth: fiscal and monetary. China has a third option. The National Development and Reform Commission can accelerate the flow of investment projects.³
Examining the detailed pattern during the pandemic in China, in both the peak Covid crisis year of 2020 and during the economic slowdown of 2022, the increase in private investment fell to very low levels — 1.0% in and 0.9% in 2022. On the other hand, overall fixed investment remained significantly higher — 2.9% in 2020 and by 5.1% in 2022.
The reason for this was that in those years China’s state investment could be and was significantly increased— a rise of 5.3% in 2020 and 10.1% in 2022. This produced a strong anti-cyclical effect in preventing a more severe decline in investment. In contrast, during 2021, when the economy was recovering and private investment was rising relatively strongly, the rate of growth of state investment was reined back to 2.9%.
The reason that China’s overall investment could remain high was only due to the large size of China’s state sector. To be precise in making a comparison to the U.S., in 2022 only 16%, less than one sixth, of U.S. fixed investment was in the state sector, accounting for only 3.4% of GDP.
Given this extremely small size of the U.S. state sector even a very high percentage increase in U.S. state investment would be unable to prevent overall U.S. fixed investment from falling. Indeed, to offset a 10% decline in private investment U.S. state investment would have to pump up by 50%. In comparison, China’s large state sector means it is possible to stabilize China’s investment level with much lower increases in state investment.
Yet, as a capitalist economy the US government spending is overshadowed by its budget deficit – spending allocations to maintain her military warfare dominance instead of taking care of population welfare, (Vine, 2022).
In short, China’s large state sector is an extremely powerful anti-crisis mechanism. This, in turn, because it sustains economic growth, prevents the type of severe crisis increases in ICOR seen in capitalist economies such as the U.S.
China’s large state sector, therefore, has a powerful effect in keeping China’s ICOR down and maintaining a high level of investment efficiency.
CONCLUSION
According to those who believe Western capitalism is a superior economic system, a capitalist system must be more efficient than a socialist one. However, as ambly amplified above, that China’s, a socialist country’s, investment was more efficient in producing economic growth than the U.S., Europe, and Japan.
Further, China’s Ministry of Commerce and 12 other government departments have had already unveiled an 11-point plan that aims to retain and boost an efficient Socialism economy.
Notes:
1 Bremner, B. (2007). ‘The Great Bank Overhaul’. In P. Engardio (Ed.), Chindia (pp. 204-210). New York, US: McGraw Hill.
2 Dumas, C., & Choyleva, D. (2011). The American Phoenix. London: Profile Books.
3 Orlik, T. (2012, May 29). Show Me The China Stimulus Money. Retrieved February 11, 2014, from Wall Street Journal.
REFERENCES
Other articles written by John Ross who – as a senior fellow at Chongyang Institute for Financial Studies, Renmin University of China – was formerly director of economic policy for the mayor of London:
Thoughts on the significance of the CPC for the Global Left, July 03, 2023;
Why China’s socialist economy is more efficient than capitalism, June 06, 2023;
“Peak China” – a new low in Western attempts to persuade China to commit suicide, May 23, 2023.
Relating to capital formation (and labour extracted surplus value) and effective national economic development with efficiency in distribution of shared common wealth in the Madani Malaysia model, read the linked references in these STORM publications.


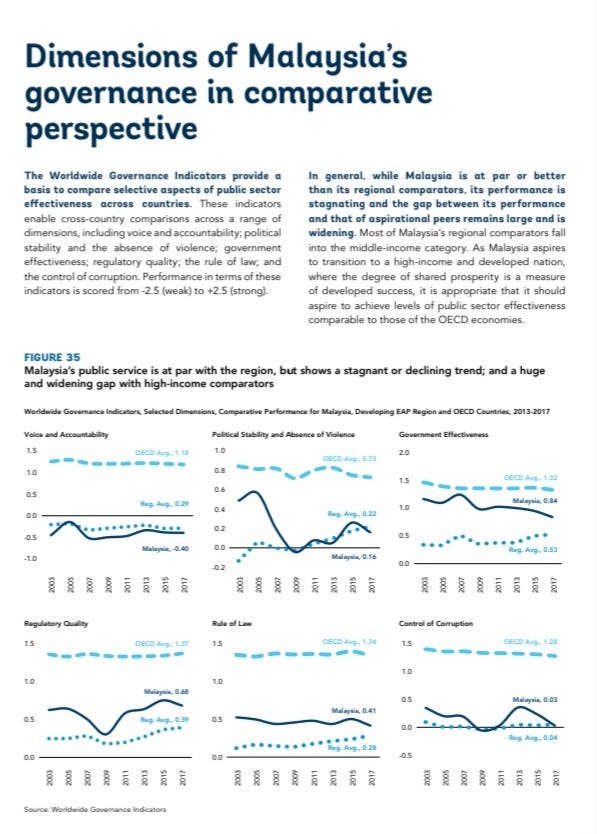
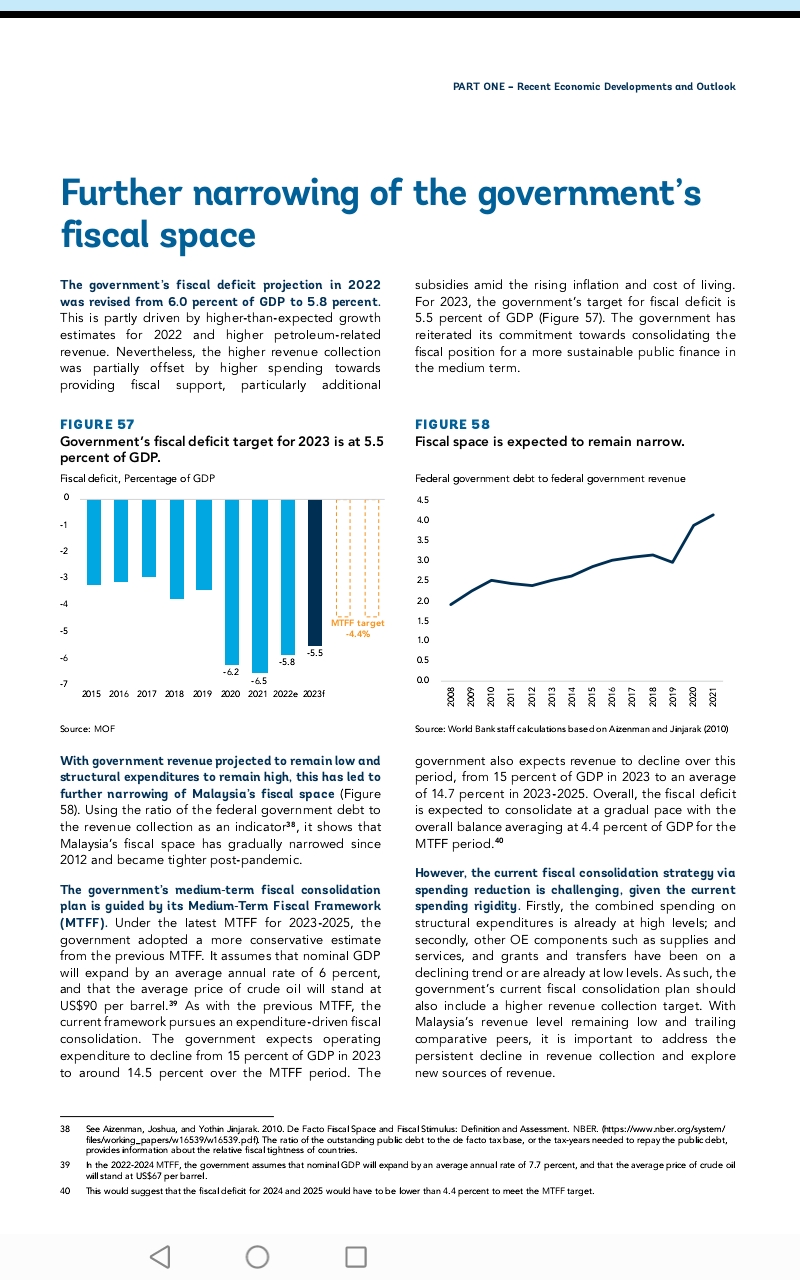
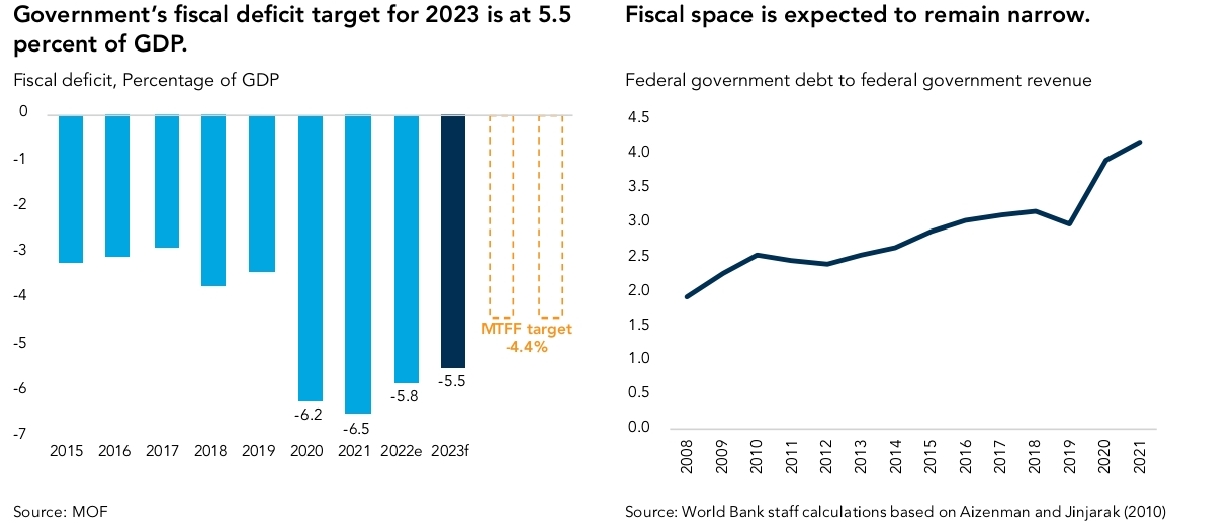 Using the ratio of the Federal Government Debt to the revenue collection as a reference point, the World Bank has indicated that Malaysia’s fiscal space has gradually narrowed since 2012, and had became even tighter post-pandemic if due developmental processes are not undertaken, (


You must be logged in to post a comment.