
1% own 43% of global wealth, while billions have no wealth at all.
Adopted from Paulo Nakatani and Rémy Herrera, The South Has Already Repaid its External Debt to the North: But the North Denies its Debt to the South, Monthly Review, June 2007, with updated adaptations on selective case countries, basing on (UNCTAD 2020, Developing country external debt: From growing sustainability concerns to potential crisis in the time of COVID-19); Eric Toussaint and Milan Rivié, Evolution of the external debt of developing countries between 2000 and 2019, Part 1,(2020); Threats over the external debt of Developing Countries Part 2 (November 2020); Developing countries in the stranglehold of debt Part 3 (April 2021); Eric Toussaint and Milan Rivié, An unsustainable burden of debt afflicts the peoples of Sub-Saharan Africa, Part 5 (May 2020); World Bank, International Debt Statistics 2021; Bank Negara Malaysia 2019, Profile of Malaysia’s External Debt – Bank Negara Malaysia; International Monetary Fund, The Debt Pandemic 2021; UNICEF, Families on the Edge, May 2021; UNFPA 2020.
1] INTRODUCTION
Since the onset of the global debt crisis in 1979 the transition and developing Global South economies had paid cumulative US$7.673 trillion in external debt service, see Paulo Nakatani and Rémy Herrera.
At the outbreak of the COVID-19 pandemic, external debt stocks of developing countries and economies in transition reached US$9.9 trillion, their highest level on record, more than twice their value of US$4.4 trillion registered in 2009, and more than four-fold their level of US$2.2 trillion in 2000, (UNCTAD 2020).
The external debts of developing and transition countries reached 29% of their GDP in 2019. The short-term debts rose to more than one-quarter of the total external debts.
Debt service on long-term external public debt (PPG) in developing and transition economies is debt sustainability (SDG) 17.4.1 where it measures “debt service as a proportion of exports of goods and services”. This indicator reflects a government’s ability to meet external creditor claims on the public sector through export revenues.
[Explanation under #13 Debt Servicing ¿].

This is of concern since low-income developing countries still rely predominantly on public financing to mobilise resources for structural transformation, yet also struggle the most with limited fiscal space given their shallow domestic financial and banking systems and limited options to refinance maturing debt obligations in the international financial markets.
The COVID-19 has translated into an ecological-epidemiological-economic shock that has put light to an epidemiological phenomenon to spotlight on the rapidly deteriorating debt sustainability in many developing countries. It threatens to turn what was already a dire situation prior to the pandemic into a series of sovereign defaults, (Rob Wallace, Alex Liebman, Luis Fernando Chaves and Rodrick Wallace, Covid19 and Circuits of Capital, Monthly Review, May 2020; John Bellamy Foster and Intan Suwandi, COVID-19 and Catastrophe Capitalism, Monthly Review, June 2020; Eric Toussaint and Milan Rivié).
2] GLOBAL SOUTH DEBT
During the same period their debt has increased from US$618 billion in 1980 to US$3.150 trillion in 2006, according to figures published by the International Monetary Fund (IMF). The external debt of this group of countries, comprising 145 member states, will continue to grow throughout 2007, according to the IMF, to more than US$3.350 trillion. The debt of the Asian developing countries alone could rise to US$955 billion, even though they have already repaid, in interest and capital, far more than the original amount due in 1980!

Malaysia 2019 external debt was RM$231225.9 million, (Asia Development Bank, External Debt Outstanding in Asia and the Pacific, Asian Development Outlook, April 2020).
3] STIMULUS PACKAGES
Total external debt service of the Global South countries grew from 2.8 percent of GDP in 1980 to 4.0 percent in 1989 and 6.9 percent in 1999, before decreasing slowly to 5.2 percent in 2006, just above the 5.1 percent average for the period.
Finance Minister Tengku Datuk Seri Zafrul Abdul Aziz said Malaysia’s statutory debt is expected to hit 58.5% of gross domestic product (GDP) in 2021 due to the implementation of an additional RM20 billion PEMERKASA stimulus package on 18th. March 2021 to safeguard the nation’s economic growth from the impact of the Covid-19 pandemic.
Whereas the previous Perlindungan Ekonomi & Rakyat Malaysia PERMAI Assistance Package introduced on 18th January 2021 – the fifth economic stimulus package to date worth RM15 billion spread over 22 initiatives aimed at combating the Covid-19 outbreak – was deemed to be inadequate.
The Finance Minister indicated that the government will exhaust and maximise the use of the RM65 billion ceiling for the Covid-19 fund approved by the Parliament under the Temporary Measures for Government Financing (Coronavirus Disease 2019 [Covid-19]) Act.
According to a report to the Asian Development Bank, in September 2020, by Donghyun Park, Arief Ramayandi, Shu Tian stating inter alia that borrowing heavily for fiscal stimulus packages to support growth and provide relief for vulnerable groups whilst at the same time, private companies and households may be forced to borrow more to survive the economic impact of COVID-19…..In addition, the economic downturn challenges their capacity to service their existing debts. Therefore, despite widespread concerns about the current escalation of public debt and its sustainability, we should not lose sight of the potential risk from possible surges of private debt…..

However, the national household debt-to-Gross Domestic Product (GDP) ratio had already surged to a new peak of 93.3% as at December 2020 from its previous record high of 87.5% in June 2020, according to Bank Negara Malaysia (BNM).
4] GLOBAL SOUTH WEALTH DISPARITY
that an increase in inequality is likely to mean more people in poverty, because at the bottom end of the income scale there will be more people further away from the average.
To the ever increasing concentration of wealth, at the national level in favour of the dominant classes of the countries of the Global South, and at an international level in favour of the countries of the Global North. It explains in large part, over the last few years, the dramatic increase in intra– and international inequalities, as well as the increase in relative and absolute poverty.
Income inequality has increased in most developed countries and in some middle-income countries, including China and India, since 1990, (United Nations, World Social Report 2020 – Inequality in a Rapid Changing World).
Countries where inequality has grown
are home to more than two thirds (71 per cent) of the world population. Yet growing
inequality is not a universal trend. The Gini coefficient of income inequality has declined
in most countries of Latin America and the Caribbean and in several African and Asian
countries over the last two decades.
Despite progress in some countries, income and wealth are increasingly concentrated
at the top. The share of income going to the richest 1 per cent of the global population
increased in 46 out of 57 countries and areas with data from 1990 to 2015.
Malaysia case scenario by UNICEF 2020 showed that low income female-headed households are exceptionally vulnerable, with higher rates of unemployment at 32% compared to the total heads of households. Female headed households also registered lower rates of access to social protection, with 57% having no access compared to 52% of total heads of households.
Meanwhile, the bottom 40 per cent earned less than 25 per cent of income in all 92 countries with data (United Nations, 2019a). In the case of Malaysia, the bottom 40% of population – the B40 – only get 16.4% of the national income share of wealth as in 2020 – not much has the wealth disparity gap closed since two decades ago, but instead, more inequality has accentuated :

5] DEBTS AND LABOUR EXPLOITATION
International debt repayment constitutes one of the forms of transfer of surplus produced by the countries of the South to the North – and of surplus produced by the workers of the South to the capitalists of their own countries and to those of the North. This has tended to increase the rate of labour force exploitation and labour conflicts in the South.
Underlining this trend, the developing countries and “emerging market” economies had transferred to their creditors an annual average of 3.68 percent of their GNP during the decade following the debt crisis (1980–89). In the past ten years (1997–2006), marked by a series of financial crises and a growing polarization of the capitalist world system, this transfer rose to 6.2 percent of GNP, (Notes: The figures are for 1980–2006. Calculation by the authors based on the data provided by the International Monetary Fund: IMF, 2006, World Economic Outlook Database, September, Washington D.C. It is the sum of annual values drawn from the line External Debt: Total Debt Service” from the group “Other Emerging Market and Developing Countries, http://www.imf.org.)
Whereas in 2012 low-income developing countries spent 3.3 per cent of their government revenues to meet external public debt obligations, this figure rose to 8.1 per cent in 2018, falling only slightly to an estimated 7.9 per cent in 2019. The squeeze on government revenues from service payments on external public (PPG) debt was particularly drastic in Sub-Saharan Africa, where this ratio jumped from a low point of 3.3 per cent in 2011 to an estimated 18.2 per cent in 2019, (monthlyreview online May 2021).
Almost one-fifth of government revenues in sub-Saharan Africa serviced external debts in 2019.
6] EXTERNAL TO INTERNAL DEBTS
Of ever increasing market integration and deregulation of capital movements, there has been a general transformation of debts to bonds on financial markets and a conversion of external debts into internal debts. This gradual evolution, which is still ongoing, hides some perverse effects, in particular that interest rates are often higher on internal debt.
It is more difficult towards a precise calculation of the size of the drain associated with this category of debts. All the more so because this transfer of surpluses from South to North continues to operate through different channels.
The disproportion of developing country debt, like the history of the monetary and financial international system, provides no indication of a solution to the current debt crisis if it is only the efforts and resources of these countries that are mobilized.
Economic, commercial, monetary and financial relations between the countries of the centre (North) and those of the periphery (the South) of the world capitalist system must be profoundly reorganized, according to new principles.
The dynamics of capitalism and capital accumulation based on the rationale of profit maximization and resource pillage towards underdevelopment of nations are injustice to humankind, (see capitalism and a reading list on Capitalism and Underdevelopment).
7] TRANSFER OF SURPLUS
The transfer of surplus from South to North continues to operate through a myriad of channels, such as the repatriation of profits on direct foreign investment, transfer pricing, price trading, profits on the revaluation of bonds recorded as portfolio investments in balance of payments, non-compliance currency transfer and other forms of unequal exchange.
These could be augmentedly completed from the operational processes of TNCs to seek low labour arbitrage and low-cost production processes (like lean to just-in-time and flexible production) and by competitive strategic advantages with product differentiation in varied products with many features and multi-functionalities at various price structures in different marketspace.
By 2008, the top one hundred global corporations which had shifted their production foreign affiliates or subsidiaries accounted for 60 percent of their total assets and employment and more than 60 percent of their total sales. The foreign direct investment (FDI) to developing economies was US$694 billion in 2018 making up 58% global FDI share. By engaging in contractual relationships with partner firms but without equity involvement, mostly in the Global South, TNCs were generating about US$2 trillion in sales in 2010 (UNCTAD, World Investment Report: Non-Equity Modes of International Production and Development (Geneva: United Nations, 2011), 131).
8] DEBT SELF-PERPETUATING
It is an undeniable fact that national debt from loans do not contribute to financing economic development. Inevitable that the debt itself is increasingly to cover repayment of interests and capital. So it functions as a self-perpetuating mechanism of poverty aggravation, work overexploitation, and a block on development in the economies of the periphery of the capitalist world system, (see John Bellamy Foster, The Imperialist World, Monthly Review, May 2007).
This is due to developing countries (DC) very dependent on their respective commodities output and global prices. One can discern a correlation between the evolution of commodity prices and DCs’ external indebtedness.
From 1998 to 2003, a period that saw backflow of DCs’ capital towards the countries of the Global North, commodity prices were relatively low. From 2003-2004 on, those prices began a steep increase culminating in 2008. This phenomenon attracted investors and lenders from the Global North who were looking for countries offering guarantees based on their resources in commodities and their export revenues.
Thus, starting from 2008, there was a period of inflowing capital from countries of the North towards the DC. The governments and big private companies of the South were incited to take on more debt taking advantage of the super-cycle of commodities. Nevertheless there was a fall in 2009 due to the global crisis triggered by the major financial crisis of 2008 in the United States and Western Europe. Commodity prices rose again in 2010. In 2014 the cycle suddenly collapsed :
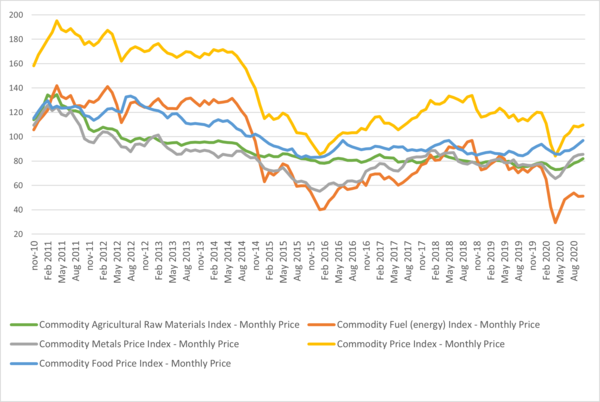
The end of the ‘super cycle’ coincided with a steady drop in DCs’ foreign exchange reserves in months of import. Whereas countries dependent on commodities are advised to hold at least three months of import in foreign exchange reserve, low income countries are now well below this threshold. With the new fall in oil prices in 2020, the drop in export revenues, the higher amounts to be repaid from 2020 onward, a number of countries, particularly oil exporting countries, may not be able to repay their public external debt :

9] ODIOUS DEBTS
The encroached interests of the dominant capitalists of the countries in the Global North collude in close collaboration with the elites of peripheral countries. These alliances often produced complex situations, such as “odious” debts (illegitimate and/or illegal), the transformation of external debts into public debts – which can often be viewed as forms of “odious” debts – and “ecological debts.” Odious debts were contracted by local elites and used against the public interest, to finance sumptuous expenses, corruption, or repression of the working classes more often than not also inciting mounting community massacres and torture as briefly documented by Milan Rivié in Illicit Flows: Africa is the world’s main creditor (November 2020).
Illicit financial flows or financial transfers can be through:
i) “Tax and commercial IFFs”, which mostly consists of fraudulent issuing of invoices for products to be imported or exported, amounting to approximately 40 billion US$ per year;
ii) “illegal markets”, which are principally human trafficking and toxic waste;
iii) “Theft-type activities and financing of crime and terrorism”; and finally,
iv) IFFs linked to “corruption”
The amount of such colossal losses, US$89 billion per year according to the lowest estimates. This amounts to 3.7% of the continent’s GDP, and 25% of Egypt’s GDP, which is one of the three largest African economies alongside South African and Nigeria. It is also, almost equivalent to the total Official Development Aid, US$48 billion, and Foreign Direct Investment, US$54 billion, received by African countries per year :

However, the substitution of private debt by public debt was a way for countries to manage the debt crisis in favour of the local bourgeoisie in the clientel capitalism system as part of the ethnocapital rentier capitalism . When the USA decided to increase interest rates – in the hope of resolving their own crisis – many government of the peripheral capitalist countries at the beginning of the 1980s, nationalised a large part of the private external debt of the local bourgeoisie imposing responsibility for the cost of the operation on the population.
Furthermore, the debt also served to finance polluting activities of transnational companies (example: Mamut Mine, Sabah) which have resulted in dramatic destruction of the environment (project: Pan-Borneo Highway) and highly negative externalities, at national (case: Lynas) and international level.
An international law on debt needs to be enacted, supplemented, as necessary, by measures requiring TNCs and their local allies of ethnocapital to pay to the countries of the Global South reparations for their “ecological debts.”
The estimated annual value of ecosystem services is US$16–54 trillion, with an estimated average of US$33 trillion. US$33 trillion is 1.8 times the current global GNP.
10] IMMERISATION OF GLOBAL SOUTH
Increasing misery is existing across wide population spectrum in countries of the Global South, particularly in Africa. Between 1980 and 2006, more than US$675billion have been extorted to finance the debt service from the African continent, even though it is the poorest in the world.
As a yearly average during this period, this corresponds to $25 billion. By way of comparison, hardly more than half of this sum would be enough, according to the estimates of the UN Food and Agriculture Organization (FAO), to eradicate hunger, thanks to the provision of food rations corresponding to nutritional levels considered to be satisfactory to each poor inhabitant of the South.
Remember that according to the World Bank, there are over four billion poor people in the world, more than 850 million people still suffer today from malnutrition, and five million children die of starvation each year in the world. The wealth accumulated in the countries of the North is in part produced by exploitation of workers and destruction of nature in the countries of the South, (John Bellamy Foster, The Ecology of Destruction, Monthly Review, February 2007; The Conversation, What Karl Marx has to say about today’s environmental problems, June 2018; The Guardian, 9th September 2020).
11] HOUSEHOLDS DEBTS
Household debt also rose in emerging economies from 26 per cent of GDP in 2009 to 43 per cent by 2019. The bulk of the overall increase in lending to private non-financial sectors was lending to non-financial corporations in these economies, increasing from around 60 per cent of GDP just before the global financial crisis to over 100 per cent by 2017, where it is UNCTAD calculations, based on conversion to US dollars at market exchange rates, from BIS (2020) data.
Malaysia’s household debt-to-Gross Domestic Product (GDP) ratio surged to a new peak of 93.3% as at December 2020 from its previous record high of 87.5% in June 2020, according to Bank Negara Malaysia (BNM). “A concern over high household debt is that it may lead to a rapid deleveraging by households in the aftermath of a crisis, thus dampening or derailing economic recovery,” BNM warned in its Financial Stability Review for Second Half 2020 Report as released.
In the short term, many economists believe this high level of household debt-to-GDP ratio is manageable and do not pose that significant a risk to the country’s financial stability.
“From a macro perspective, it should not have a big impact on financial stability. Broadly, the risk from the household sector to the entire banking system remains manageable.
“BNM has taken pre-emptive measures and has the capacity to introduce further macroprudential tools if the financial environment requires it to,” said World Bank senior economist Shakira Teh Sharifuddin.
UOB (M) Bhd economist Julia Goh concurred, saying the high ratio is due to weaker GDP owing to the pandemic. It is also a result of government incentives to spur purchase of cars and property ownership.
“In a way, that has aided the recovery by supporting consumption amid a low interest rate environment. Other household financial stability indicators do not suggest higher risks so far given stable household financial asset-to-debt ratios and high excess savings.”
However, Institute for Democracy and Economic Affairs (IDEAS) chief executive officer Tricia Yeoh is sceptical of the lower-income households’ capacity to service their loans, and called on the government to reassess its policies to ensure economic recovery may be achieved without overstraining households.
Similarly, Socio-Economic Research Centre (SERC) executive director Lee Heng Guie highlighted the disproportionate impact of the pandemic on different levels of household income. “Clearly, there are segments of the household that are currently facing financial distress. My concern is for those who are highly geared, [who] will eventually go through a de-gearing process to rebuild their savings. This will in turn reduce consumption and curtail economic growth later,” he said.
However, there are three lingering concerns that need to be acknowledged, and be addressed:
i) If such high household debt levels persist, they may result in an unhealthy financial system that is fragile to future economic disruptions. Over the long term, if there is another downturn, and if the high level of household debt is not addressed, then definitely there is less room for monetary policy to take effect because households are already indebted to a high level.
The case of Malaysia: the bottom 40% of population – the B40 – only get 16.4% of the national income share of wealth as in 2020.
ii) There is an underlying issue on economic inequality, which, if not addressed, may pose systemic risk to the whole financial system.
iii) Then, there is the specter of income instability amongst the B40 group. Any shift in income, especially for lower-income households, will put them at risk of defaulting on these loans.
Malaysian household incomes are projected to fall by 12 per cent, which is est upimated amounted to RM$95 billion; and job losses are estimated to be of 2.4 million positions, 67% of which is unskilled labour, on the details that MIER released in 2020. Indeed, household debt – at nearly 83 per cent to gross domestic product – is among the highest in Asia.
12] PRIVATE EXTERNAL DEBTS
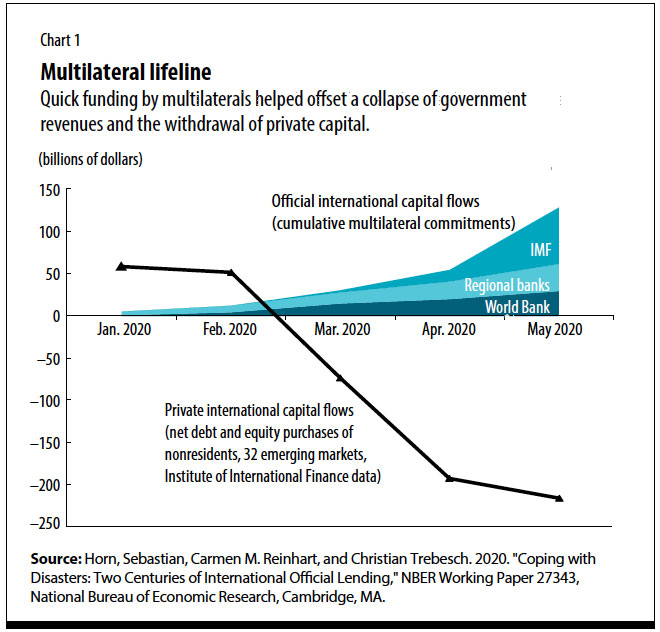
Concurrent with the above issues are the high levels of private external indebtedness that are of concern since they represent a large contingent liability on public sector finances, ultimately backed by international reserves held in the domestic economy. In the event of wide-spread private sector debt distress, governments will have little choice but to transfer the bulk of distressed private debt to public balance sheets.
The fragility of developing countries’ debt positions was further increased by accompanying changes to the ownership of long-term external public (PPG) debt. The share of PPG external debt of developing and transition governments owed to private creditors reached 62 per cent of the total in 2019, compared to around 20 per cent in the 1970s and 41 per cent in 2000. Its most volatile component, public bond finance, is clearly on the increase relative to financing through commercial bank loans and other private creditors. This reflects the growing reliance of developing country governments on refinancing their external debt obligations in international financial markets with strong speculative features rather than borrowing from official bilateral and multilateral creditors, which is generally more stable and in more favourable terms.
However, amid the pandemic most government revenues collapsed alongside economic activity, while private capital flows came to a sudden stop :
13] DEBT SERVICING
As cursory mentioned before, the rising external debt burden along with increased risk profiles of such debt shall translate into rising servicing costs. Debt service ratios are considered important indicators of a country’s debt sustainability.
In this sense, SDG indicator 17.4.1 measures “debt service as a proportion of exports of goods and services”. This indicator reflects a government’s ability to meet external creditor claims on the public sector through export revenues. A fall (increase) in this ratio can result from increased (reduced) export earnings, a reduction (increase) in debt servicing costs, or a combination of both. A persistent deterioration of this ratio signals an inability to generate enough foreign exchange income to meet external creditor obligations on a country’s PPG debt, and thus potential debt distress in the absence of multilateral support or effective sovereign debt restructuring.
It has been indicative that only high-income developing countries have maintained a stable ratio of external long-term PPG debt to export revenues of around two to four per cent in the last decade. This is largely due to their greater capacity to issue domestic public debt, with a view to avoid currency mismatches.
However, while greater reliance on local-currency denominated public debt reduces the vulnerability to exchange rate volatility, it frequently creates maturity mismatches.
In contrast, a marked increase of debt service ratios has been registered since 2012 across all other income categories: in middle-income countries this ratio rose from 3.1 per cent in 2012 to 6.9 per cent in 2019 and in low-income countries from 2.5 to 7.0 per cent. SIDS saw this ratio rise from a low point of 4.9 per cent in 2013 to 8.2 per cent in 2019. As these economies increasingly tapped into international capital markets, this reflects rising external public debt stocks since 2012 in a context of commodity price volatility, sluggish global economic growth and rising debt service, (UNCTAD 2020, World Investment Report 2020).
The Malaysia FEDERAL government debt and liabilities rose to RM$1.2569 trillion, or 87.3% of GDP, as at end-September 2020— up 7.5% in the first nine months of the year compared with RM$1.1692 trillion as at end-2019. Indeed, country’s revenue is not rising as fast as the increase in operating expenditure that is more than 95% of revenue since 2008. Assuming the economy is set to expand by 7.5% in nominal terms during 2021 to RM$1,521.3bil, Malaysia’s official debt to GDP and total debt to GDP is expected to rise to 64.1% and 77.9%, respectively in 2021, (The Star, 20 Mar 2021).
The debt service charges made up 14% (RM32.9 billion) of federal government revenue in 2019 and is estimated to take up 15.4% or RM34.95 billion of the government’s income in 2020. The amount is expected to rise even further to RM39 billion, or 16.5% of the government’s revenue for 2021, according to data in the Fiscal Outlook 2021 Report.
Even governments in high-income developing countries are often unable to issue long-term government securities at a sustainable rate of interest, yet they need to be able to pay off or roll over maturing short-term obligations.
14] REDEMPTION SCHEDULES
As a consequence of their rising indebtedness, developing countries face a wall of debt service repayments throughout the 2020s.
The redemption schedules for 2020 and 2021 already accumulated external public debt obligations alone amount to an estimated US$2 to 2.3 trillion in high-income developing countries and between US$700 billion to $1.1 trillion in low-and middle-income countries.

The challenge posed by large debt overhangs must, however, be placed in the wider context of economic challenges arising from the COVID-19 crisis. While developed countries are putting together massive stabilisation packages to flatten both the pandemic curve and the curve of economic and financial crisis, this is not an option open to many developing economies, at least not at the required scale.
On one hand, developing countries cannot easily lock down their largely informal economies effectively without more people being affected by hunger rather than by illness. On the other, they face substantive limitations on their fiscal space to mount rescue packages comparable to those currently under way in developed economies.
Seriousness in case country Malaysia is that general government debt jumps to 76.0% of GDP in 2020 from 65.2% of GDP in 2019. The debt figures used by Fitch include officially reported “committed government guarantees” on loans, which are serviced by the government budget, and the 1MDB’s net debt, equivalent in September 2020 to 12.6% and 1.3% of GDP, respectively. On this basis, the debt burden is significantly higher than the medians of 59.2% and 52.7% for the ‘A’ and ‘BBB’ rating categories, respectively; we have been degraded to BBB by Fitch last year. Malaysia’s debt is close to 400% of revenue, around three times the peer median.
15] GOVERNMENT REVENUES SHARE
Moving beyond SDG indicator 17.4.1, the share of government revenues dedicated to servicing PPG debt rose sharply over recent years, particularly in the poorest developing economies.
Whereas in 2012 low-income developing countries spent 3.3 per cent of their government revenues to meet external public debt obligations, this figure rose to 8.1 per cent in 2018, falling only slightly to an estimated 7.9 per cent in 2019.
The squeeze on government revenues from service payments on external PPG debt was particularly drastic in Sub-Saharan Africa, where this ratio jumped from a low point of 3.3 per cent in 2011 to an estimated 18.2 per cent in 2019. In other words, governments in this region now spend, on average, almost one fifth of their revenues on servicing external public debt, see Eric Toussaint and Milan Rivié, An unsustainable burden of debt afflicts the peoples of Sub-Saharan Africa, Part 5 (May 2020).
This is of concern since low-income developing countries still rely predominantly on public financing to mobilise resources for structural transformation, yet also struggle the most with limited fiscal space given their shallow domestic financial and banking systems and limited options to refinance maturing debt obligations in the international financial markets.
that Malaysia’s total debt and liabilities as September 2020 include RM177 billion in committed government guarantees, 1Malaysia Development Bhd’s (1MDB) debt of RM32.3 billion (principal excluding interest costs) as well as RM173.3 billion in lease payments for public-private partnerships (PPP).
16] CENTRAL BANKS ROLES
To pay for imports and to meet external debt obligations, the vast majority of developing countries are heavily reliant on access to hard currencies, earned primarily through commodity and service exports, such as food, oil and tourism, or received through remittances, as well as access to further concessional and market-based borrowing.
Their central banks cannot act as lenders of last resort to their governments to the extent central banks in developed economies can without risking a large depreciation of their local currencies and its effects in terms of steep increases in the value of foreign-currency denominated debt.
This has the potential to unleash destructive inflationary pressures. But with volumes of international trade experiencing a sharp contraction, core commodity prices in free fall, tourism at a virtual standstill, remittances drying up and private capital outflows from developing countries reaching unprecedented levels in recent history, many developing economies are increasingly cut off from conventional sources of income when they need them most.
On the respondibilities of central banking post-Global Finance Crisis: READ former deputy governor of Bank Negara Malaysia
17] DECISIVE ACTIONS BY COUNTRIES
It is against this backdrop that already existing debt vulnerabilities and distress in developing countries require decisive action to avoid liquidity constraints turning into wide-spread insolvency crises.
Early multilateral initiatives to provide some breathing space to hard-hit developing countries include US$215 million in debt cancellation by the IMF of repayments due by the 25 poorest developing economies between May and October 2020, as well as the G20 “Debt service suspension initiative for poorest countries” between May and December 2020.
There are 73 primarily low-income developing countries are eligible under the above-stated initiative that could see the temporary suspension of up to around $18 billion in repayments on official bilateral debt. While these initiatives are welcome, they are unlikely to be sufficient in either scale or scope.
It has to be noted, however, new borrowing, for example in fast growing COVID-19 bond markets as well as through increased access to concessional multilateral lending, can help bridge immediate liquidity needs but it is bound to add to, rather than resolve, unsustainable external debt burdens. Well-designed debt relief – through a combination of temporary standstills with sovereign debt reprofiling and restructuring – will therefore be essential to address not only immediate liquidity pressures, but also to restore long-term external debt sustainability in many developing countries, not least with a post-COVID-19 view of achieving the 2030 Agenda for Sustainable Development, ( see UNCTAD (2020b) for more detail ).
Refer to Point #3 above regarding Malaysia PERMAI and the PEMERKASA stimulus packages
18] CADTM
Contrary to the dominant discourse, it is actually the case that the 54 African states finance developed countries and not the other way round. Similarly to the CADTM, the UNCTAD report also supports this claim. With IFFs rising to 836 billion dollars from 2010 to 2015, and an external debt of 770 billion dollars in 2018, “the continent [is] being labelled a ‘net creditor to the world’”.
Indeed up to 20 to 30 per cent of private wealth in many African countries is held in tax havens” and there were “almost 5,000 individuals from 41 African countries with assets of about $6.5 billion” in offshore bank accounts in 2015. In both cases, this type of major corruption is enabled by the (lack of) action of major powers, see various reports in the Tax Justice Network’s website: https://fsi.taxjustice.net/en/; Fergus Shiel and Will Fitzgibbon, “About the Mauritius Leaks Investigation”, ICIJ, 23rd July 2019, https://www.icij.org/investigations/mauritius-leaks/about-the-mauritius-leaks-investigation/ ; the ICIJ’s research: https://www.icij.org/investigations/luanda-leaks/ and Marlène Panar, “Luanda Leaks, ou l’effondrement de l’empire dos Santos” in French or [Luanda Leaks and the unravelling of the dos Santos Empire], 21st January 2020, Le Point Afrique: https://www.lepoint.fr/afrique/luanda-leaks-ou-l-effondrement-de-l-empire-dos-santos-20-01-2020-2358701_3826.php (in French).
The former governor of Bank Negara Malaysia (BNM) case is exposed HERE, and explored further by theedgemarkets in the 8th. March 2020 issue.
The Committee for the Cancellation of Third World Debt (Comité pour l’Annulation de la Dette du Tiers Monde—CADTM), or Jubilee South, consider, with reason, that the developing countries have paid off their external debt to Northern creditors, in totality, and that it is the rich countries that effectively owe debts to the poorest countries.
19] IMF-WORLD BANK-PARIS CLUB
However, the countries at the centre of the world capitalist system and their multilateral monetary and financial institutions, above all the IMF, the World Bank, and the Paris Club – all have no interest in resolving the problem of external debt, because it represents a reliable means of keeping the countries of the South in perpetual dependence.
The structure of the external debt of developing countries from the point of view of creditors (rounded-off figures as provided by the World Bank on the indebtedness of developing countries in 2018) :

This comes about as an outcome of the Bretton Woods Agreement whose focus was to construct an international monetary order centered on the U.S. dollar. Other currencies were to be pegged to the US dollar, which was in turn pegged to gold, (see Cheng Enfu and Lu Baolin, Characteristics of Neoimperialism, Monthly Review, May 2021).
The U.S. dollar has played the prominent role in world currency, since replacing the British sterling pound, thus designating the U.S. a dominant global positioning. As such, the U.S. dollar makes up 70 percent of global currency reserves, accounting for 68 percent of international trade settlements, 80 percent of foreign exchange transactions, and 90 percent of international banking transactions. Owing to this financial dominance, the U.S. dollar has also become the internationally recognized reserve currency and trade settlement currency.
Often, serious financial hardship for a number of countries is dependent on revenues from oil, agriculture or minerals. This factor has been aggravated by the devaluation of currencies of countries from the South against the US dollar, see Eric Toussaint and Milan Rivié, Developing countries in the stranglehold of debt, Part 3 (April 2020).
The United States can also obtain international seigniorage by exporting U.S. dollars. She can reduce its foreign debt by depreciating the U.S. dollar or assets that are priced in U.S. dollars. The hegemony of the U.S. dollar has also caused the transfer of wealth from debtor countries to creditor countries. This would, in fact, mean that poor countries would subsidize the rich.
20] NEOLIBERALISM’s NEO-IMPERIALISM
Neoimperialism is monopolistic financial capitalism established by large transborder multinationals whose production and capital are “concentrated into fewer and fewer hands.” (see John Bellamy Foster, Robert W. McChesney, and R. Jamil Jonna, “Monopoly and Competition in Twenty-First Century Capitalism,” Monthly Review 62, no. 11, 2011 :1).
Neo-Imperialism monopolizes almost all sources of raw materials, scientific and technological talent, and skilled physical labour in all fields, controlling the transportation hubs and infrastructural platforms by various modes and means of production – and by owning, controlling and dominating capital, global financial functions and associated derivatives and information technologies through vast cultural and military shareholding systems, it has
indebted all poverty poors of the world
more Malaysian Manuscripts available HERE

You must be logged in to post a comment.