
Adapted the theoretical framework, and material contents therein, from John Bellamy Foster, New Imperialism of Globalized Monopoly Finance Capital, MonthlyReview, 2015, and adopted the arguments, with added new materials, diagrams and footnotes, from the blog in Post-1997 Political Economy.
____________________
PROLOGUE
Former deputy governor of Bank Negara Malaysia,
Dr Sukudhew (Sukhdave) Singh, wrote an article in LinkedIn and reposted in TheEdge exerting that: Malaysia risks not being a high-income economy even over the next 20 years, that is commented in Post-1997 Political Economy, followed by Towards Post-2020 Political Economy and Financialization of Healthcare: Capital and Health Equities, besides exploratory studies that were completed in Financialization Capitalism: Penetration of Neo-Imperialism in Malaysia and Financialization Capitalism in a Covid19 Political Economy – underlying the emergence, and intrusiveness, of financialization capitalism as a contributing cause to the widening national debt and the consequential economic stagnation in Malaysia political economy.
1. INTRODUCTION
That what is widely referred to as neoliberal globalization in the twenty-first century is in fact a historical product of the shift to global monopoly-finance capital or what Samir Amin calls the imperialism of “generalized-monopoly capitalism.”
In the twenty-first century imperialism is thus taking on a new, more developed phase related to the globalization of production and finance.
The shift of manufacturing industry in recent decades from the Global North to the Global South. In 1980 the share of world industrial employment of developing countries had risen to 52 percent; by 2012 this had increased to 83 percent.
By 2013, 61 percent of the total worldwide inward flow of foreign direct investment was in developing and transitional economies, up from 33 percent in 2006 and 51 percent in 2010.
From 1970 to 1989 the average annual per capita GDP of the developing countries, excluding Greater China, was a mere 6.0 percent of the per capita GDP of the G7 countries (the United States, Japan, Germany, France, the United Kingdom, Italy, and Canada). For the period of 1990 to 2013, this had dropped to only 5.6 percent.
Meanwhile, for the forty-eight Least Developed Countries, average annual per capita GDP as a share of that of the G7 declined over the same periods from 1.5 percent to a mere 1.1 percent.
The Economist announced that this trend has now reasserted itself. At the present rate of growth in the developing world, The Economist insisted, it would take developing/emerging countries as a group (outside of China) more than a century -and even possibly as long as three centuries – to catch up with the income levels of the rich countries of the center, (The Economist, “The Headwinds Return,” September 13, 2014).
2. THE SCENARIOS
Behind such dirt wages in the periphery lies the whole history of imperialism and the fact that in 2011 the global reserve army of labor (adding up the unemployed, vulnerably employed, and economically inactive population) numbered some 2.4 billion people, compared to a global active labor army of only 1.4 billion. It is this global reserve army – predominantly in the Global South, but also growing in the Global North – which holds down the labor income in both center and periphery, keeping wages in the periphery well below the average value of labor power worldwide, as articulated by John Bellamy Foster, Robert W. McChesney and R. Jamil Jonna in The Global Reserve Army of Labor and the New Imperialism.
Consequently, big winners are the transnational corporations. Apple subcontracts the production of the component parts of its iPhones in a number of countries with the final assembly in China subcontracted to Foxconn. Owing to low-end wages paid for labor-intensive assembly operations, Apple’s profits on its iPhone 4 in 2010 were found to be 59 percent of the final sales price.
For each iPhone 4 imported from China to the United States in 2010, retailing at $549, about $10 went to labor costs for production of components and assembly in China, amounting to 1.8 percent of the final sales price, and Jason Dedrick, “Capturing Value in Global Networks: Apple’s iPad and iPhone,” Paul Merage School of Business, University of California, Irvine, July 2011, see Figure 1 below:

In the international garment industry, in which production takes place almost exclusively in the Global South, direct labor cost per garment is typically around 1–3 percent of the final retail price, according to senior World Bank economist Zahid Hussain. Wage costs for an embroidered logo sweatshirt produced in the Dominican Republic run at around 1.3 percent of the final retail price in the United States, while the labor cost (including the wages of floor supervisors) of a knit shirt produced in the Philippines is 1.6 percent. Labor costs in countries such as China, India, Indonesia, Vietnam, Cambodia, and Bangladesh were considerably lower than in the above cases, see Zahid Hussain, “Financing Living Wage in Bangladesh’s Garment Industry,” End Poverty in South Asia, South Asian Region of the World Bank, August 3, 2010, http://blogs.worldbank.org.
The surplus value captured from such workers is thus enormous, while being disguised by the fact that the lion’s share of so-called “value added” is attributed to activities (marketing, distribution, corporate salaries) in the wealthy importing country, removed from direct production costs, see Figure 2 below on a respective example by an industrial sector in oil production upon which surplus value is extracted from labour. In 2010, the Swedish retailer Hennes & Mauritz was purchasing T-shirts from subcontractors in Bangladesh, paying the workers on the order of 2–5 cents (euro) per shirt produced.

Nike, a pioneer in Non-Equity Modes of International Production, outsources all of its production to subcontractors in countries such as South Korea, China, Indonesia, Thailand, and Vietnam. In 1996, a single Nike shoe consisting of fifty-two components was manufactured by subcontractors in five different countries. The entire direct labor cost for the production of a pair of Nike basketball shoes retailing for $149.50 in the United States in the late 1990s was 1 percent, or $1.50.
A part of the imperialist rent remains in the peripheral country and is not transferred to the center, but constitutes rather a payment to local ruling classes for their roles in the globalization game. About $21 trillion of this global tribute, meanwhile, is currently parked abroad in tax-haven islands, “the fortified refuge of Big Finance.” see International Consortium of Investigative Journalists on their Fin-Tech files, and the Guardian, “£13tn Hoard Hidden from Taxman by Global Elite” July 21, 2012, and Nicholas Shaxson, Treasure Islands (London: Palgrave Macmillan, 2011), 7.
3. FINANCIAL CAPITALISATION
Under these circumstances, as corporations in the 1970s and ’80s sought to hold onto and expand their growing economic surplus in the face of diminishing investment opportunities, they poured their massive surpluses into the financial structure, seeking and obtaining rapid returns from the securitization of all conceivably ascertainable future income streams. Increased concentration (“mergers and acquisitions”) and its attendant new debt, securitizations representing the income stream of already-existing mortgages and consumer debt that piled new debt on old, and new issues of debt and equity that capitalized the potential future monopoly income of patent, copyright, and other intellectual property rights, all followed one another. The financial sector provided every sort of financial instrument that could arguably be serviced by a putative income stream, including from the trading in financial instruments themselves. The result, as Magdoff and Sweezy already documented in the early stages of the process from the late 1970s to the ’90s, was a vast increase in the financial superstructure of the capitalist economy.
This financialization of the economy had three major effects.
First, it served to further uncouple in space and time – though a complete uncoupling is impossible – the amassing of financial claims of wealth or “asset accumulation” from actual investment, i.e., capital accumulation. This meant that the leading capitalist economies became characterized by a long-term amassing of financial wealth that exceeded the growth of the underlying economy (a phenomenon recently emphasized in a neoclassical vein by Thomas Piketty) – creating a more destabilized capitalist order in the center, manifested in the dramatic rise of debt as a share of GDP.
Secondly, the financialization process became the major basis (together with the revolution in communications and digitalized technology) for a deepening and broadening of commodification throughout the globe, with the center economies no longer constituting to the same extent as before the global centers of industrial production and capital accumulation, but rather relying more and more on their role as the centers of financial control and asset accumulation. This was dependent on the capture of streams of commodity income throughout the world economy, including the increased commodification of other sectors – primarily services that were only partially commodified previously, such as communications, education, and health services, see STORM: Financialization of Healthcare: Capital and Health Equities.
The third point, it is relevant to read: Paul A. Baran and Paul M. Sweezy, Monopoly Capital (New York: Monthly Review Press, 1966), 107–8; Paul M. Sweezy, “Obstacles to Economic Development,” in C.H. Feinstein, Socialism, Capitalism, and Economic Growth (Cambridge: Cambridge University Press, 1967), 194–95, to get the underlying rationality, and that is, “the financialization of the capital accumulation process,” as Sweezy called it, led to an enormous increase in the fragility of the entire capitalist world economy, which became dependent on the growth of the financial superstructure relative to its productive base, with the result that the system was increasingly prone to asset bubbles that periodically burst, threatening the stability of global capitalism as a whole – most recently in the Great Financial Crisis of 2007–2009.
4. MONOPOLY CAPITAL
Given its financial ascendancy, the United States is uniquely able to externalize its economic crises on other economies, particularly those of the global South. As Yanis Varoufakis notes in The Global Minotaur, “To this day, whenever a crisis looms, capital flees to the greenback. This is exactly why the Crash of 2008 led to a mass inflow of foreign capital to the dollar, even though the crisis had begun on Wall Street.”; see Yanis Varoufakis, The Global Minotaur (London: Zed, 2011), 100–102;
The phase of global monopoly-finance capital, tied to the globalization of production and the systematization of imperial rent, has generated a financial oligarchy and a return to dynastic wealth, mostly in the core nations, confronting an increasingly generalized (but also highly segmented) working class worldwide. On the growing role of dynastic wealth see Thomas Piketty, Capital in the Twenty-First Century (Cambridge, MA: Harvard University Press, 2014), 439–43.
The leading section of the capitalist class in the core countries now consists of what could be called global rentiers, dependent on the growth of global monopoly-finance capital, and its increasing concentration and centralization, Fred Magdoff and John Bellamy Foster, “Stagnation and Financialization,” Monthly Review 66, no. 1 (May 2014): 1–23.
The reproduction of this new imperialist system, as Amin explains in Capitalism in the Age of Globalization, rests on the perpetuation of five monopolies: (1) technological monopoly; (2) financial control of worldwide markets; (3) monopolistic access to the planet’s natural resources; (4) media and communication monopolies; and (5) monopolies over weapons of mass destruction.
Behind all of this lie the giant monopolistic firms themselves, with the revenue of the top 500 global private firms currently equal to about 30 percent of world revenue, funneled primarily through the centers of the capitalist system and the core financial markets.
As Boron points out with respect to the world’s 200 largest multinational corporations, “96 percent…have their headquarters in only eight countries, are legally registered as incorporated companies of eight countries; and their boards of directors sit in eight countries of metropolitan capital. Less than 2 percent of their boards of directors’ members are non-nationals…. Their reach is global, but their property and their owners have a clear national base.”
5. DEBT AND STAGNATION
The total debt service (% of GNI) in Malaysia was reported at 3.6036 % in 2016, according to the World Bank collection of development indicators, compiled from officially recognized sources like values, historical data, forecasts and projections as on December of 2020.
[Total debt service is the sum of principal repayments and interest actually paid in currency, goods, or services on long-term debt, interest paid on short-term debt, and repayments (repurchases and charges) to the IMF]
AND
From the Bank Negara Malaysia Report on Indebted to Debt: An Assessment of Debt Levels we noted that individual borrowers are more likely to have negative financial margin if they :
(i) earn less than RM3,000 per month; and/or
(ii) have a DSR level of above 60%.
[(DSR) Debt Service Ratio = The ratio of total monthly bank and non-bank debt obligations to monthly disposable income (net of statutory deductions]
Besides,
Loans for the purchase of residential properties
remain the largest component of household
debt, representing 52% of total household loans.
The significant contribution of housing loans
towards household debt raises two key issues, namely, housing affordability and the necessity
of owning a home.
However, with a growing mismatch between prices of new house launches and households’ actual affordability, imbalances in the housing market have worsened in recent years.
In fact, in certain parts of Malaysia, the median house price is as high as five times the annual median household income, rendering houses in these areas ‘seriously unaffordable’.
[Affordability thresholds are based on the Median Multiple approach by Demographia International (2017)].
This has led to households needing to borrow more for house purchases with the average size of housing loans approved increasing from RM180,275 to RM420,230 over the past 10 years.
THOUGH,
Debt service charges are expected to remain manageable at RM34.9 billion or 15.4% of total projected government revenue in 2020, despite being higher than the initial estimate of 14.3% announced under Budget 2020.
The increase in debt service charges is due to an anticipated drop in public revenue given the energence of Covid-19 pandemic and the onset of lower crude oil prices, according to the Economic Outlook 2021 as reported by Wong Ee Lin, theedgemarkets.com, November 06, 2020.
However, like preceeding years, the financing cost of domestic debt instruments is expected to contribute the largest share at 97.7% of debt service charges, while the balance is from stable offshore borrowings at RM29.3 billion, mainly in the US dollar (54.6%) and Japanese yen (44.8%).
Further, owing to the Covid-19 pandemic, the investors’ interest in debt papers have shifted to short-tenure instruments. As at end-September 2020, the share of short-term papers with remaining maturity of five years and below had increased to 39% from 37.5% in 2019.
As a consequence of the above stated parameters, the federal government debt had grown to RM874.3 billion or 60.7% of gross domestic product (GDP) as at end-September 2020, of which RM845 billion was domestic debt, compared with RM792.99 billion previously.
With the DEFICIT likely to increase, the Government expects its fiscal deficit to swell to 6% of Gross Domestic Product (GDP) in 2020 – the largest gap since the Global Financial Crisis in 2008 (GFC2008), due to the additional stimulus packages to lift the country’s economy out of the doldrum plus lower GDP as a result of the COVID-19 outbreak.
As a result, there is an estimated PUBLIC REVENUE SHORTFALL estimated at around 20% from the budget estimates. In the Fiscal Policy review, the Ministry of Finance said the lower than expected revenue will be cushioned by additional dividends and a special contribution from Government entities such as Petroliam Nasional Bhd (Petronas), Khazanah Nasional Bhd and Retirement Fund (Inc) (KWAP)
Whether the expected high amount of dividends from Petronas as in previous years is questionable, besides Khazanah’s contributions is marginal compared to Petronas whereas whatever can issued from KWAP would impact possibly on its future dividends payout, likely effecting it’s long term sustainability, too.
Whatever, the bad debt is worrisome.
World Bank Group lead economist Richard Record had indicated that Malaysia has already depleted much of its available fiscal space and would emerge from the current crisis with a larger burden of debt and contingent liabilities despite the debt ratio had been approved by Parliament to increase from 55% to 60% of the gross domestic product (GDP). There would be difficult intertemporal constraints to further expand expenditures on relief and consumption-supporting stimulus over the near term.
This scenario shall leave national economy less endowed to invest in lasting recovery while maintaing growth in the future.
A paper published by the International Monetary Fund titled ‘Debt and Growth: Is There a Magic Threshold?’’ stated that countries with a debt-to-GDP ratio of 90 per cent and above could experience a dramatic decline in economic growth.
Even Moody Services had stated that the still-wide deficit for 2021 would increase the government’s fiscal consolidation challenge over the next few years. Further, any back-loading of efforts to reduce its debt burden over the year 2022 and 2023, will leave our national debt to the next generation of political leaders, and the present youth populace, to burden.
To finance the estimated deficit of between six and seven per cent, the national economy needs an increase in its borrowings beyond the self-imposed debt ceiling of 55 per cent of the GDP that have since upgraded to 60% by Parliament on 24th August 2020.
To a few local economists, in the financial institutions and stockbrokerage, their unsaid projection is that a 75% of GNP in the debt ceiling could only vindicate Sukhdave‘s pessimism on country’s growth rate and the ominous signs in the Post-1997 Political Economy paper.
However, empirical studies have revealed that the accumulation of external debt is typically associated with an increase in Malaysia’s economic growth up to an optimal level only. Any additional increase of external indebtedness beyond that specific level would inversely contributed to a detrimental national economy; as validated by World Bank sentiment as stated above.
This is thus likely scenario since Post-1997 period whence the growth rate had halved of what was Malaysia economic performance since then. There were visible increases in flow of money in the economy as per Post-1997 Political Economy:
Since 1997, the country had relied extensively on these Malaysian Government Securities for budget deficit financing where part of the budget deficits was financed by creating or printing new
currency notes (“helicopters’ monies”). Also part of the debt papers was monetized; therefore, money supply and currency in circulation increased sharply since 1999, to see Figures 4 and 5 in the Mohamed Aslam and Raihan Jaafar paper.

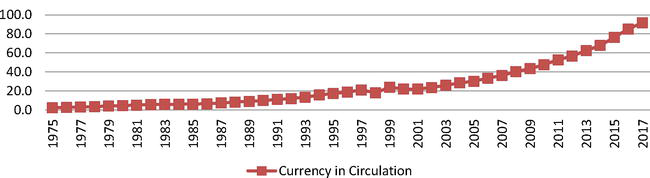
In short, the amount of money floating around is not to generate wealth but within the circuit of financialization capitalism components of FIREs (finance, interests, real estate) are in furtherance of repaying mortgage loans, hire purchases, insurances, real estates tax dues and other debt interests.
Then, there is the leakage outside the country through the estimated 5 million (2 millions registered and 3 million illegals) migrant workers who remitted their salaries homes; Rosli and Kumar had researched and written that already in 2006 the remittances made in the Malaysian economy amounted to ₤72M monthly (about RM$500 million every month, then).
Not only a large sum of money flows out of the country, migrant workers do not spend much locally to create a spread effect to contribute, and induce, economic growth; typically, a migrant worker would only spend MY$ 200 (₤29) monthly. This amount, if compared to a Malaysian’s monthly expenditure is very low; on average, the Malaysian locals spend MY$1,943 per month in urban areas and MY$1,270 in rural areas,(Department of Statistics Malaysia, 2004/5).
The high percentage of immigrant construction
workers exposes the country to high remittances that disturbs the economic cycle flow in the form of leakages (Mustapa and Pasquire, 2007), thus strangling economic growth.
Mohamed Aslam and Raihan Jaafar had expressed to the effect of budget deficits on macroeconomics in terms of crowding out private investment, increasing interest rates, expanding money supply and escalating consumer price and in certain extent affect exchange rate. Government bonds issued to finance budget deficits are also in question as part of the net wealth of private sectors. This is because if there is a continuous growth of debt, creditors may become concerned about the government’s initiative to repay it. Over time, these creditors will expect higher interest payments to provide a greater return for their increased perceived risk as it is widely acknowledged that higher interest costs dampen economic growth.
EPILOGUE
This financialization of the economy had these major effects:
1] It uncouples spatial temporally the amassing of financial claims of wealth or “asset accumulation” from actual investment, that is, capital accumulation.
This meant that the leading capitalist economies became characterized by a long-term amassing of financial wealth that exceeded the growth of the underlying economy creating a more destabilized capitalist order in the center, manifested in the dramatic rise of debt as a share of GDP.
2] Then, financialization process becomes the major basis (assisted by digitalized technology) for a deepening and broadening of commodification throughout the globe.
With the Global North economies as the centers of financial control and asset accumulation and capturing streams of commodity income throughout the world economy, including the increased commodification of other sector – primarily services that were only partially commodified (read privatized and commercialised) previously, such as communications, education, and health services.
3] Third, “the financialization of the capital accumulation process,” as Sweezy called it, led to an enormous increase in the fragility of the entire capitalist world economy. We became increasingly prone to asset bubbles threatening the stability of global capitalism as a whole since the Great Financial Crisis of 2007–2009 (GFC-2007) experience that we never able to sustain the high 8% growth rate as before because real structural reforms were not performed in the country.
We are, as a nation, fossilized in a stupor state from emergence of the Srivijaya and Majaphit empires, intrusions by the Portuguese and Dutch, colonised by the British, occupied by the Japanese and under neo-Colonialism and neo-Imperialism since ever under a thorough Kleptocracy governance.
APPENDIX
Nakornthab (2010) indicates that mortgage loan constitutes the largest portion of Malayia’s household debts, follows by hire-purchase loan, credit card loan and personal loan. Yusof, Rokis and Jusoh (2015) claim that Malay and Indian ethnic are vulnerable to financial shocks due to high household debts.
Consequently, the financial situation for many Malaysian households has already reached a vulnerable level (Rani et al.,2017; Yusof et al., 2015).
Olin Liu, Malaysia: From Crisis to Recovery, IMF Occasional Paper No: 207.

You must be logged in to post a comment.